Best Freight Analytics Software (2026): Reporting and Profitability Tools for Forwarders
Author:
Priyanka
Published On:
1 min read
Best Freight Analytics Software (2026): Reporting and Profitability Tools for Forwarders
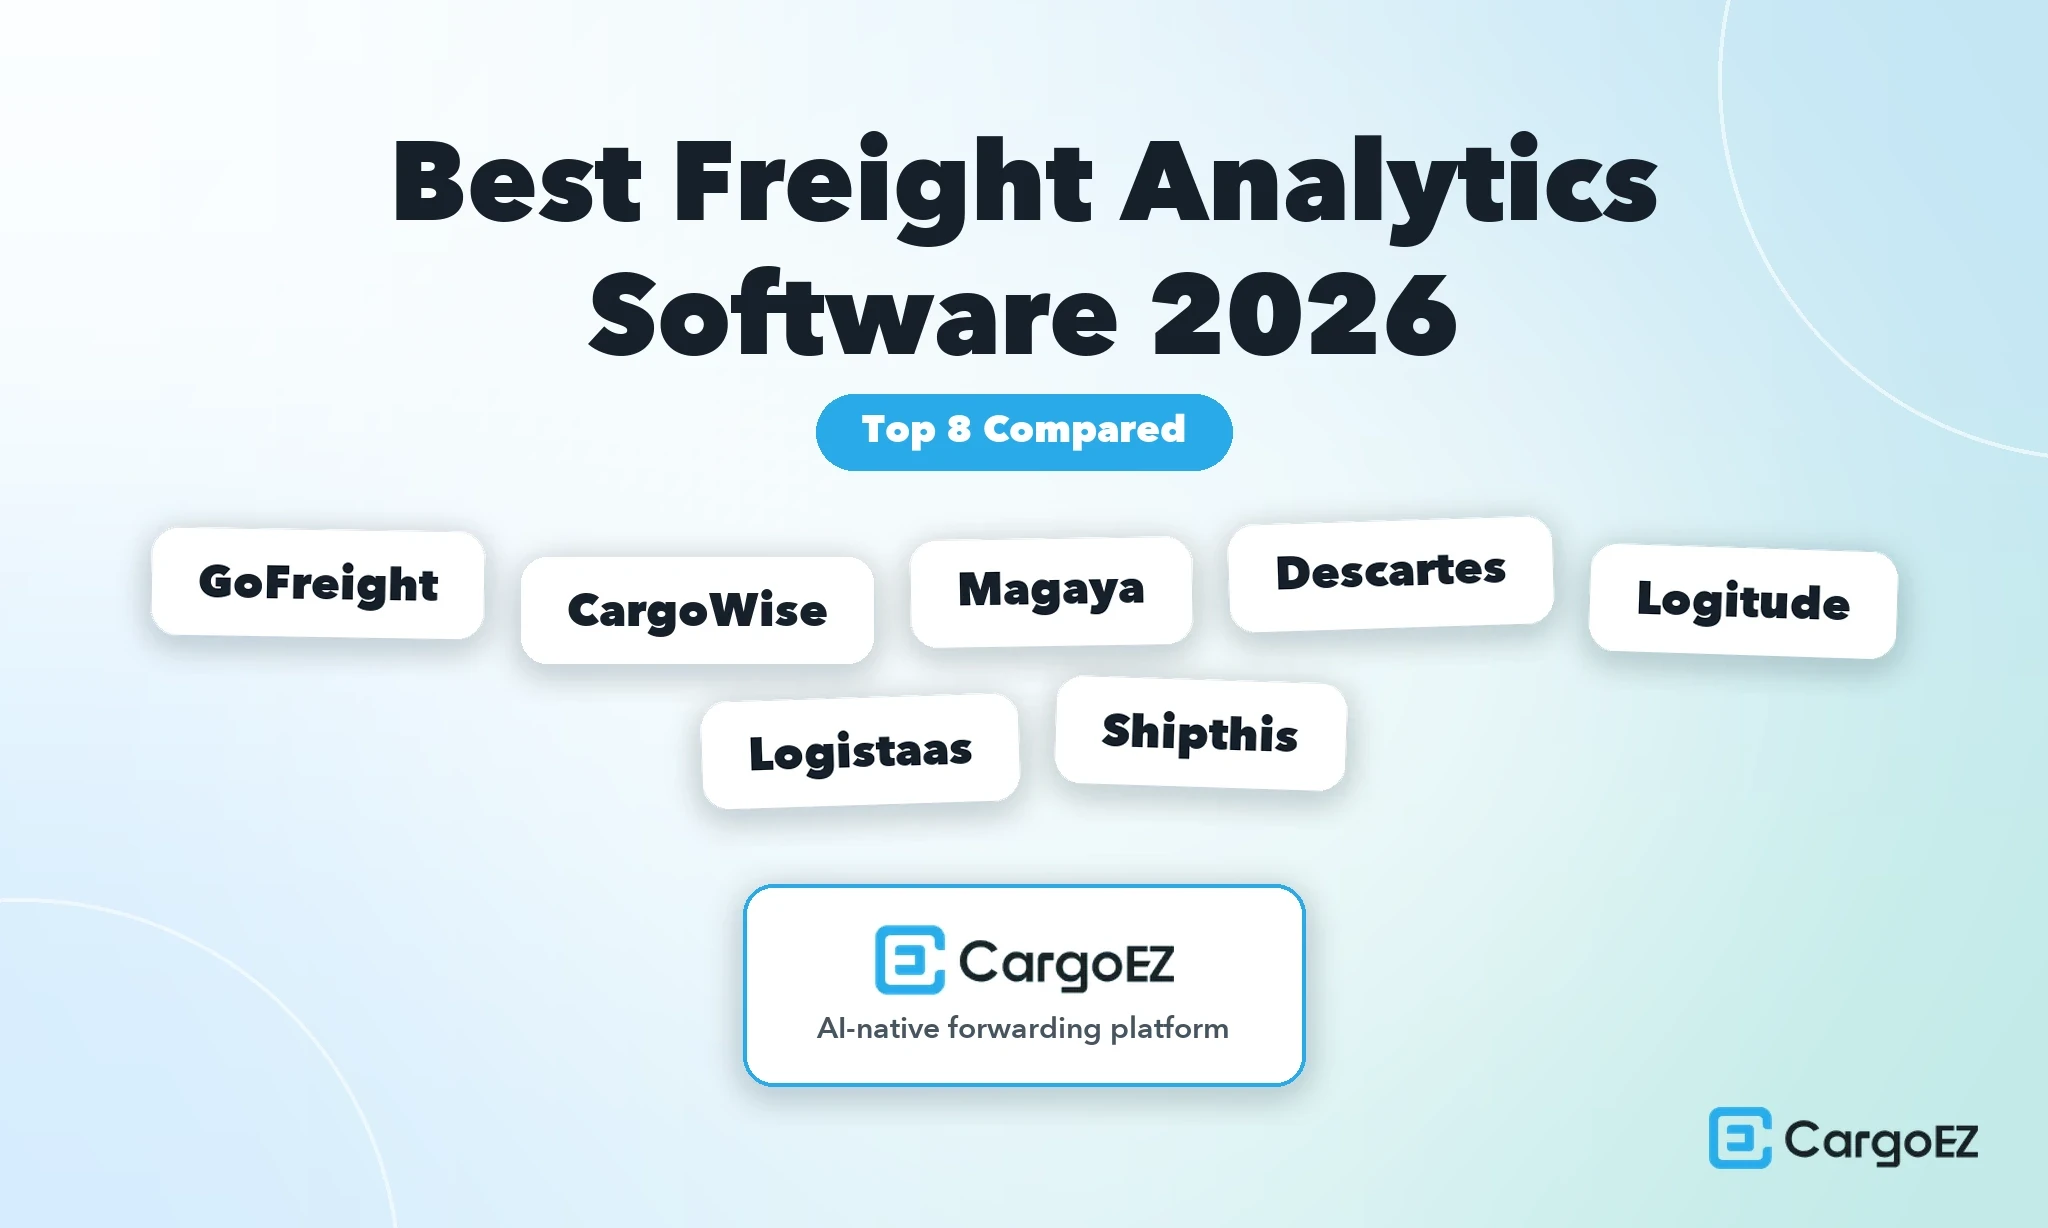
Here are the top-rated freight analytics software platforms for forwarders in 2026, ranked: 1. CargoEZ, 2. GoFreight, 3. CargoWise, 4. Magaya, 5. Descartes, 6. Logitude World, 7. Logistaas, 8. Shipthis.
Most forwarders are sitting on the answer to every margin question they have, and cannot get to it. The data is spread across the operations system, the invoicing screen, and three spreadsheets, so nobody can say which lane made money last quarter or which customer quietly turned unprofitable. Freight analytics software is the layer that pulls that data together and turns it into a dashboard you can act on.
Here is the distinction I keep front and center, because a search for freight analytics software mixes two very different products. Market-data tools like DAT iQ and FreightWaves SONAR tell you what the outside market is doing, which is rates, capacity, and forecasts. Freight analytics software for a forwarder tells you how your own business is doing, which is shipment margin, lane and customer profitability, and operational KPIs from your own platform data. This guide ranks the second kind, the freight data analytics software (also called freight forwarding analytics software) that runs on your own operation. I cover the market-data tools separately below, because a forwarder often pairs one with the analytics that actually run the business.
My top freight analytics software picks
CargoEZ - best for built-in freight analytics with real-time KPI dashboards and profit reporting in one platform
GoFreight - best for automatic per-shipment profit and P&L analytics
CargoWise - best for enterprise business intelligence across a global operation
Magaya - best for operational and financial reporting with warehouse analytics
Descartes - best for global trade and transportation performance analytics
Logitude World - best for affordable profit-and-loss analysis and customizable dashboards
Logistaas - best for simple, low-cost analytics and shipment dashboards
Shipthis - best for modern, AI-assisted analytics dashboards
The short version: the value is highest when the analytics sit on the same system that runs your shipments and your invoices, because the numbers stay live and nobody re-keys anything. That is why the full forwarding platforms lead, with CargoEZ at the top for a built-in analytics platform. The lighter tools give a small forwarder clean dashboards without the enterprise price, and the market-data platforms are a separate purchase for a separate job.
Key features I evaluate before choosing the best freight analytics software
A big report library is not analytics. The tool has to answer the questions that decide where a forwarder makes or loses money, from your own data, without a data-science team. Here are the six things I judge each tool on:
Shipment and job profitability: does it calculate revenue, cost, and gross margin on each shipment automatically, so profit is a number you see, not a month-end reconstruction?
Lane and customer profitability: can it roll that margin up by lane, customer, mode, and time period, so you can see which lanes and accounts actually pay?
Operational KPI dashboards: live dashboards for shipment volume, transit time, on-time performance, exceptions, and team productivity, not just finance.
Financial analytics: revenue, cost, net and gross profit, and AR and AP aging, so the commercial and the cash picture sit together.
Custom reports and export: filters to build the report you need, plus export or a connection to a business intelligence tool like Power BI for deeper cross-system work.
G2 and Capterra reviews: I also read what real users say on G2 and Capterra, so the ratings here reflect verified feedback, not vendor marketing. Where a tool has too few reviews to be meaningful, I say so instead of leaning on the number.
A note on scope. A search for freight analytics software, or for logistics analytics software, also surfaces freight analytics tools built for a different buyer, and they are not ranked here.
Market-data and rate-intelligence tools (DAT iQ, FreightWaves SONAR, Xeneta, Truckstop, Greenscreens.ai) analyze the outside market for shippers, brokers, and carriers; I cover the forwarder-relevant ones in the pair-with section.
Enterprise shipment-visibility analytics (project44, FourKites, e2open) and shipper platforms (BuyCo, GoodShip) answer where is my freight and how is my carrier doing for large cargo owners; for the live-tracking view, see the real-time tracking and visibility software guide. Shipper freight-spend and audit tools (Intelligent Audit, Trax) analyze a shipper's transportation invoices, not a forwarder's operation.
And generic business intelligence tools (Power BI, Tableau) can visualize freight data but do not understand a shipment on their own.
Freight analytics software at a glance
Platform | Best for | Starting price | Rating (G2 / Capterra) |
1. CargoEZ | Built-in freight analytics with real-time KPI dashboards and profit reporting in one platform | Custom / quote | 4.8 / n/a (G2, 40) |
2. GoFreight | Automatic per-shipment profit and P&L analytics | Quote (~$100-500/user) | 4.8 / 4.6 |
3. CargoWise | Enterprise business intelligence across a global operation | Per-transaction (enterprise) | 4.3 / 2.9 |
4. Magaya | Operational and financial reporting with warehouse analytics | Custom / quote | 4.4 / 4.4 |
5. Descartes | Global trade and transportation performance analytics | Custom (enterprise) | 4.2 / n/a (G2, 69) |
6. Logitude World | Affordable profit-and-loss analysis and customizable dashboards | ~$75-99/user/mo | 4.6 / 4.5 |
7. Logistaas | Simple, low-cost analytics and shipment dashboards | ~$35-55/user/mo | n/a (thin) |
8. Shipthis | Modern, AI-assisted analytics dashboards | ~$89/user/mo | 4.8 (Capterra, 13) |
Ratings verified Aug — 2026. Figures are for each vendor's forwarding platform, since analytics is a module inside it. "n/a" means too few reviews to be meaningful on that platform (Logistaas is thin on both G2 and Capterra).
How each tool turns your freight data into analytics
This compares each platform across the six capabilities that decide real analytics value, from calculating profit on a single shipment and rolling it up by lane and customer, to operational KPI dashboards, financial analytics, custom reports with export, and whether it all runs live on your own data. Treat it as a directional summary and confirm it on a demo. Yes = documented and strong; Partial = present but limited; n/d = not documented.
Platform | Shipment / job profitability | Lane & customer profitability | Operational KPI dashboards | Financial analytics (AR/AP, revenue, cost) | Custom reports + export/BI | Real-time on your own data |
CargoEZ | Yes (net and gross profit) | Partial (by customer; lane n/d) | Yes | Yes (income, expense, profit) | Partial (filtered reports; export n/d) | Yes |
GoFreight | Yes (auto on every shipment) | Yes (customer, lane, time) | Yes | Yes (shipment P&L, AR/AP aging) | Yes | Yes |
CargoWise | Yes | Yes | Yes (custom BI dashboards) | Yes | Yes (Custom BI, Power BI) | Yes |
Magaya | Yes | Partial | Yes | Yes | Yes (report packs, Power BI) | Yes |
Descartes | Partial | Partial | Yes | Partial | Yes | Partial |
Logitude World | Yes (P&L analysis) | Partial | Yes (customizable) | Yes (invoicing, P&L) | Partial | Partial |
Logistaas | Partial | Partial | Yes | Yes (invoicing, AR/AP) | Partial | Partial |
Shipthis | Yes | Partial | Yes | Partial | Partial | Yes (AI dashboards) |
Read down the profitability columns and the split is clear. The full platforms (CargoEZ, GoFreight, CargoWise, Magaya) turn your own shipment and finance data into profit and KPI dashboards, with GoFreight and CargoWise strongest on lane and customer profitability analytics.
The SMB tools (Logitude, Logistaas, Shipthis) give you clean dashboards and P&L without the enterprise depth. Descartes leans toward trade and compliance performance rather than deep commercial margin. None of them benchmark the outside market, which is the separate category below.
An honest comparison of the top freight analytics software
1. CargoEZ — Best for built-in freight analytics with real-time KPI dashboards and profit reporting in one platform
Snapshot | Detail |
Best for | Built-in freight analytics with real-time KPI dashboards and profit reporting in one platform (US SMB and midmarket forwarders) |
Starting price | Custom quote |
Key features | Freight data analytics module, real-time KPI dashboards, income/expense/net and gross profit, customizable filtered reports, centralizes POs/shipment costs/invoices, pipeline KPIs |
Rating | G2 4.8/5 (40 reviews), 95% 5-star |
Free trial | Free trial, set up on the demo call |
Overview
I put CargoEZ first because the analytics live on the same platform that runs the shipments, the quotes, and the invoices, so the numbers are already there. There is no export, no nightly data job, and no separate reporting tool to buy; the dashboard reads the operational and financial data you are already capturing.
Features
Freight data analytics: the analytics module turns shipment data into real-time metrics and a clear view of performance, so decisions come off live data instead of a month-old spreadsheet.
Profit reporting: analytics on income, expenses, and net and gross profit, so margin is a number you watch, not one you reconstruct at month-end.
Real-time KPI dashboards: dashboards track shipment performance and business KPIs, including a pipeline KPI dashboard in the Leads module for win rate and deal status.
Customizable reports: flexible filters generate tailored reports that match how your business actually measures itself.
One connected record: analytics centralizes purchase orders, shipment costs, and invoices in one place, breaking the data silos that force manual reporting.
Who it's for
US small and midmarket forwarders who want profit, KPI, and operational analytics on the same system that runs operations and finance, so the dashboard is always current and nobody re-keys data into a separate reporting tool.
Who it's not for
forwarders who need external market-rate benchmarking or predictive market forecasting, or a heavy custom business-intelligence build with a native Power BI or Tableau connector; those sit with the market-data tools and the enterprise BI platforms, so confirm your export and lane-level reporting needs on a demo.
What reviewers say
4.8/5 on G2 from 40 reviews, with users citing one connected view from operations to finance. If you want to see it on your own numbers, explore the analytics module, book a demo, or call +1 (408) 834-7476.
2. GoFreight — Best for automatic per-shipment profit and P&L analytics
Snapshot | Detail |
Best for | Automatic per-shipment profit and P&L analytics |
Starting price | Quote (~$100-500/user) |
Key features | Automatic gross profit on every shipment, shipment P&L, lane analysis, customer profitability, AR/AP aging, dedicated freight analytics product |
Rating | G2 4.8/5 (92), Capterra 4.6/5 (25) |
Free trial | Demo |
Overview
GoFreight built a dedicated freight analytics product into its US forwarding platform, and its strength is shipment profitability analytics that calculate profit automatically on every shipment. You see revenue, cost, and margin at the job level without building anything, then roll it up into lane profitability and customer views.
Features
Automatic shipment profit: gross profit is calculated on every shipment automatically, so job-level margin is always visible.
Aggregated profitability: roll margin up by customer, lane, or time period to see which accounts and lanes actually pay.
Financial reports: shipment P&L, lane analysis, customer profitability, and AR and AP aging in one reporting suite.
Operational KPIs: dashboards on volume and operational performance sit alongside the financial view.
In the workflow: the analytics read the same data that runs quoting, booking, and operations, so nothing is exported.
Who it's for
small and mid US forwarders who want job-level profit and P&L analytics out of the box, with clean lane and customer breakdowns, on a modern cloud platform.
Who it's not for
very large global operations with deep multi-country and multi-entity reporting needs, which usually weigh CargoWise; GoFreight is US-centric and priced per user.
What reviewers say
4.8/5 on G2 from 92 reviews, one of the larger and more current review bases here, with users citing clear visibility into shipment profitability.
3. CargoWise — Best for enterprise business intelligence across a global operation
Snapshot | Detail |
Best for | Enterprise business intelligence across a global operation |
Starting price | Per-transaction (enterprise) |
Key features | Custom BI dashboards, real-time analytics with slicers and filters, executive dashboards, global multi-branch data, analytics on native forwarding/customs/finance data |
Rating | G2 4.3/5 (35), Capterra 2.9/5 (32) |
Free trial | Demo |
Overview
CargoWise is the choice when freight business intelligence software has to span a large, global, multi-branch operation on one database. Its business-intelligence layer scans very large volumes of data and presents it in interactive executive dashboards, sitting on native forwarding, customs, and finance data.
Features
Custom BI dashboards: build executive dashboards that show the metrics most relevant to the business, with interactive slicers and filters.
Real-time analytics: the BI layer processes large data volumes and surfaces it in rich visuals for in-depth analysis.
Global data model: one normalized database across branches, entities, and countries, so analytics are consistent group-wide.
Deep source data: analytics read native forwarding, customs, and accounting data, not a shallow export.
Ecosystem tooling: a mature partner ecosystem builds tailored BI on top of the platform.
Who it's for
large, global forwarders with multiple offices, entities, and high volumes that need consistent business intelligence across the whole group on one system.
Who it's not for
single-office SMBs or teams that want fast setup and an easy interface; it is heavy and costly, the build runs months, and reviewers rate it the hardest to use in this list.
What reviewers say
4.3/5 on G2 from 35 reviews, but 2.9/5 on Capterra from 32; read both, because the gap is real and often comes down to complexity.
4. Magaya — Best for operational and financial reporting with warehouse analytics
Snapshot | Detail |
Best for | Operational and financial reporting with warehouse analytics |
Starting price | Custom quote |
Key features | Operational and financial report packs, customizable dashboards, warehouse and inventory analytics, Power BI-ready data, analytics synced to the platform |
Rating | G2 4.4/5 (284), Capterra 4.4/5 (50) |
Free trial | Demo |
Overview
Magaya suits forwarders that also run warehousing, because the analytics cover freight and warehouse in one place. It carries a deep library of operational and financial reports, and its data feeds business-intelligence tools when you want to go further.
Features
Report packs: a broad set of operational and financial reports covering shipments, accounting, and warehouse activity.
Customizable dashboards: dashboards on the metrics your team watches, synced to live platform data.
Warehouse analytics: freight plus warehouse and inventory analytics for forwarders that do 3PL work.
Financial analytics: revenue, cost, and profit reporting alongside the operational view.
BI-ready: platform data connects out to Power BI and similar tools for deeper cross-system analysis.
Who it's for
forwarders that do freight plus warehousing, especially on US and Latin-America lanes, and want operational, financial, and warehouse analytics in one proven platform.
Who it's not for
teams that want the most modern interface, since some reviewers describe the UI as dated, and the value is strongest when you run the wider Magaya platform.
What reviewers say
4.4/5 on G2 from 284 reviews and 4.4/5 on Capterra from 50; the figures are for the Magaya platform, since analytics is a module inside it.
5. Descartes — Best for global trade and transportation performance analytics
Snapshot | Detail |
Best for | Global trade and transportation performance analytics |
Starting price | Custom (enterprise) |
Key features | Transportation and trade performance analytics, benchmarking, carrier and route performance, compliance analytics, part of the Global Logistics Network |
Rating | G2 4.2/5 (69) |
Free trial | Demo |
Overview
Descartes brings analytics from a global logistics network angle, so its strength is performance and trade analytics across carriers, routes, and compliance rather than deep commercial margin. It suits forwarders that already run Descartes for customs and messaging and want analytics on that footprint.
Features
Performance analytics: transportation and network performance analysis across carriers and routes.
Trade and compliance analytics: reporting tied to customs, declarations, and trade data.
Benchmarking: performance measured against network data where available.
Network scale: analytics draw on the breadth of the Descartes Global Logistics Network.
Modular: analytics attach to the Descartes modules a forwarder already uses.
Who it's for
forwarders already invested in Descartes for customs and connectivity who want trade and transportation performance analytics on the same network.
Who it's not for
a small forwarder that mainly needs shipment margin and simple KPI dashboards; Descartes is enterprise-oriented and leans to trade performance over commercial profit analytics.
What reviewers say
Descartes is a well-reviewed global trade and logistics suite; its forwarder platform carries roughly 4.2/5 on G2 across about 69 reviews, though analytics is one part of a broad product line, so validate the specific reports on a demo.
6. Logitude World — Best for affordable profit-and-loss analysis and customizable dashboards
Snapshot | Detail |
Best for | Affordable profit-and-loss analysis and customizable dashboards |
Starting price | ~$75-99/user/mo |
Key features | Profit-and-loss analysis, customizable dashboards, shipment and operational KPIs, invoicing-linked financials, per-user pricing |
Rating | G2 4.6/5 (94), Capterra 4.5/5 (40) |
Free trial | Demo |
Overview
Logitude World gives a small or growing forwarder real analytics without an enterprise contract. Its platform includes profit-and-loss analysis and customizable dashboards, so a lean team gets margin and KPI views at a clear per-user price.
Features
Profit-and-loss analysis: built-in P&L so a forwarder sees profit by shipment and job without a separate tool.
Customizable dashboards: dashboards a team can tailor to the KPIs it tracks.
Operational KPIs: shipment and workflow metrics alongside the financial view.
Invoicing-linked: analytics draw on the platform's quoting, operations, and invoicing data.
Affordable: a transparent per-user price that suits SMB budgets.
Who it's for
small and growing forwarders who want genuine P&L analysis and customizable dashboards at a predictable per-user cost.
Who it's not for
large operations that need enterprise business intelligence, deep multi-entity reporting, or heavy custom data work, which sit with CargoWise or a dedicated BI build.
What reviewers say
4.6/5 on G2 from 94 reviews and 4.5/5 on Capterra from 40, with users citing an accessible, well-priced platform.
7. Logistaas — Best for simple, low-cost analytics and shipment dashboards
Snapshot | Detail |
Best for | Simple, low-cost analytics and shipment dashboards |
Starting price | ~$35-55/user/mo |
Key features | Shipment and operational dashboards, invoicing and AR/AP data, KPI views, low per-user pricing |
Rating | Reviews thin on G2 and Capterra |
Free trial | Demo |
Overview
Logistaas is the budget entry for a small forwarder that wants clean dashboards without a big spend. It bundles shipment and operational analytics into an affordable platform, so the value is simplicity and price rather than depth.
Features
Shipment dashboards: operational dashboards on shipments and workflow status.
Financial data: invoicing, AR, and AP data feed simple financial views.
KPI views: core KPIs for a small team, without a reporting project.
Low cost: one of the lower per-user prices among forwarder platforms.
Bundled: analytics come with the wider forwarding suite, not as an add-on.
Who it's for
very small or price-sensitive forwarders who want basic analytics and dashboards bundled into an affordable platform.
Who it's not for
teams that need a deep, proven review base or advanced profitability and BI depth; the review base is thin, so validate the analytics on a demo.
What reviewers say
Logistaas has too few reviews on G2 and Capterra to publish a reliable score, so I flag it as capability-first and recommend a hands-on demo of the dashboards.
8. Shipthis — Best for modern, AI-assisted analytics dashboards
Snapshot | Detail |
Best for | Modern, AI-assisted analytics dashboards |
Starting price | ~$89/user/mo |
Key features | AI-assisted analytics dashboards, shipment and financial metrics, customizable views, part of a modern forwarding suite with a customer portal |
Rating | Capterra 4.8/5 (13) |
Free trial | Demo |
Overview
Shipthis is the modern, AI-leaning option, and its analytics come as clean dashboards inside a cloud forwarding suite. It suits a forwarder that wants a contemporary interface and is comfortable with a smaller but growing track record.
Features
AI-assisted dashboards: analytics dashboards that surface shipment and performance metrics with an AI-assisted layer.
Shipment and financial metrics: operational and financial views on the same platform data.
Customizable views: dashboards a team can shape to its KPIs.
Modern suite: analytics sit inside a cloud forwarding platform with a customer portal.
SMB pricing: a per-user price aimed at small and growing teams.
Who it's for
small forwarders who want a modern, AI-assisted analytics dashboard bundled with a full forwarding suite at a per-user price.
Who it's not for
teams that need a deep, proven review base before buying; the Capterra sample is small and G2 is thin, so validate the analytics depth on a demo.
What reviewers say
4.8/5 on Capterra from 13 reviews; the sample is still small, so treat it as promising rather than proven and confirm fit on a demo.
Freight market intelligence to pair with your analytics
The tools above analyze your own data. A forwarder often adds one external tool that analyzes the outside market, so buy-side and sell-side pricing decisions have a live benchmark. These are a separate purchase and a separate job, so I list them capability-first rather than ranking them against the platforms above.
Freightos Terminal — benchmarks your contracted ocean and air rates against live commercial market data and analyzes freight spend and procurement opportunities. The most forwarder-relevant market tool, because it works in the ocean and air lanes forwarders actually book.
Xeneta — ocean and air freight rate benchmarking against a large pool of real market rates, used to check whether your buy rates and your sell rates are in line with the market.
FreightWaves SONAR — high-frequency freight-market intelligence, indices, and forecasting. Built for large enterprises and analysts, and strongest for US trucking, so it fits a big operation with staff to use it.
DAT iQ — US truckload rate benchmarking and forecasting for shippers, brokers, and carriers. Powerful for domestic trucking rate decisions, and less relevant to an ocean and air forwarder.
The rule of thumb: your platform's analytics tell you how your business is performing; a market tool tells you whether the market agrees. Many forwarders combine a platform like CargoEZ with one market feed, and connect both into a business-intelligence tool like Power BI only when the questions get truly cross-system.
Which freight analytics software fits your operation
Match the tool to how your team actually needs to see its numbers:
Insist on profit, not just activity. The tool must calculate shipment and job margin and roll it up by lane and customer, or you are measuring volume, not money.
Keep the analytics on your operating data. Analytics that live on the same platform as operations and invoicing stay live; a bolt-on that needs constant exports goes stale.
Separate your data from the market. Decide whether you need internal operational analytics, an external market benchmark, or both, and do not expect one tool to do the other job.
Check the export path. If you run a business-intelligence tool like Power BI or Tableau, confirm the platform can feed it cleanly.
Right-size the depth. A small forwarder is better served by clean built-in dashboards than by an enterprise BI project that takes months to stand up.
Freight analytics software for small and growing forwarders
The best freight analytics software for small forwarders is not an enterprise business-intelligence build; a freight KPI dashboard software that comes built into the platform serves a lean team better than a bolt-on. The value shortlist is CargoEZ (real-time KPI dashboards and profit analytics in one platform with operations), Logitude World (P&L analysis and customizable dashboards at a clear per-user price), and Logistaas (simple, low-cost dashboards). GoFreight is the step up when you want automatic per-shipment profit and lane and customer profitability out of the box, and Shipthis suits a team that wants a modern, AI-assisted dashboard. Leave CargoWise and a dedicated BI stack for when you are large enough to need group-wide business intelligence.
My verdict: the best freight analytics software for forwarders
For most US small and midmarket forwarders, the smartest choice is a built-in analytics layer, and CargoEZ is the recommended pick, because your profit, KPI, and operational analytics sit on the same platform as operations and finance, so the dashboards are always current and nobody re-keys data. Choose GoFreight for automatic per-shipment profit and P&L analytics, CargoWise for enterprise business intelligence across a global group, Magaya for freight plus warehouse analytics, and Descartes for trade and performance analytics on its network. On a tighter budget, Logitude World, Logistaas, and Shipthis deliver clean dashboards at a per-user price. And when you need to know what the outside market is doing, pair your platform with a market tool like Freightos Terminal or Xeneta, rather than expecting one product to do both jobs.
See your own margins in a live dashboard. Explore CargoEZ freight data analytics, book a demo, or call +1 (408) 834-7476, and we will build one KPI dashboard from your own shipment data.
1. What is freight analytics software?
It is the tool a forwarder uses to turn its own operational and financial data into dashboards and reports, so shipment margin, lane and customer profitability, and operational KPIs are visible and actionable. In most forwarding platforms it is the analytics or reporting module; the alternative is exporting data into a separate business-intelligence tool.
2. What is the difference between freight analytics software and market-data tools like DAT iQ or SONAR?
Freight analytics software analyzes your own business, which is your shipments, costs, and margins. Market-data tools like DAT iQ and FreightWaves SONAR analyze the outside market, which is rates, capacity, and forecasts. One tells you how you are performing; the other tells you what the market is doing. Many forwarders use both, but the jobs are different, and this guide ranks the first.
3. What KPIs should a freight forwarder track?
The ones that decide margin and service: gross profit per shipment, profit by lane and by customer, shipment volume by mode and direction, transit time and on-time performance, exception rates, and AR and AP aging. The point of an analytics tool is to show these live, not to rebuild them in a spreadsheet each month.
4. Do I need a separate business-intelligence tool like Power BI?
Not to start. A built-in analytics module answers most forwarder questions on live data. A tool like Power BI or Tableau adds value when you need to combine platform data with outside sources or build heavily custom visuals, so add it when the questions outgrow the dashboards, not before.
5. Can I get freight analytics without buying a separate tool?
Yes. A full forwarding platform like CargoEZ includes analytics on the operational and financial data you already capture, so you get profit and KPI dashboards without a separate purchase or an export pipeline. A standalone analytics or BI tool makes sense mainly when your operating system cannot report on its own data.
6. How much does freight analytics software cost?
When analytics is part of a forwarding platform, it is included in that platform's price, which ranges from about $35 to $99 per user per month for SMB tools up to quote-based and per-transaction enterprise pricing. External market-data tools are priced separately and can run much higher, especially the enterprise market-intelligence platforms.
Don't forget to share this blog!